Computing the Final Output
Final output was computed by the help of function below. After successful completion one will get following things
Files Generated
File Name |
File Type |
File Extension |
Description |
|---|---|---|---|
Output |
Text file |
.txt |
This file contains elimination constant etc data of the drug. |
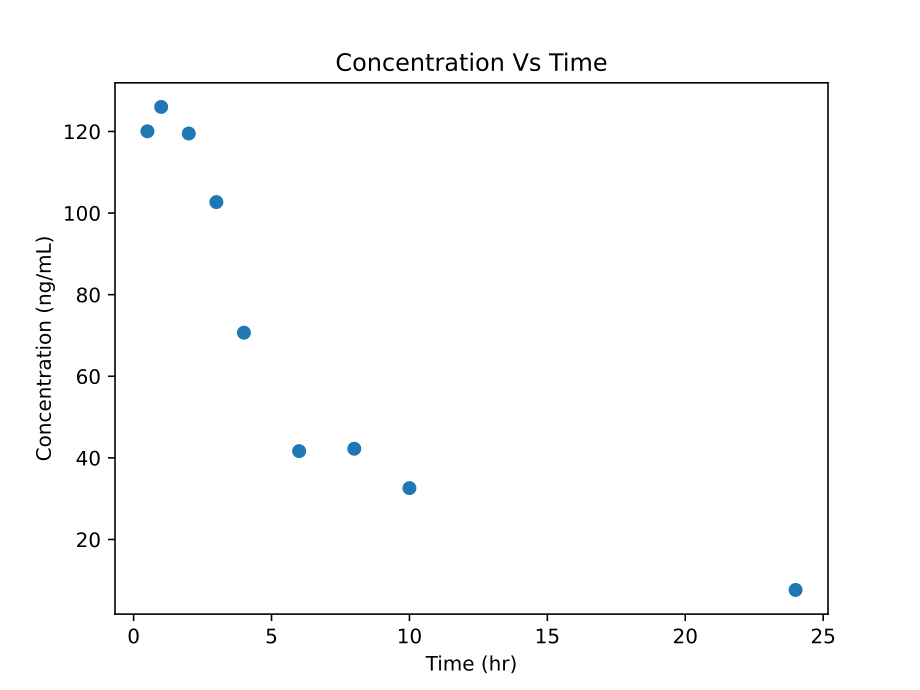
ConcVsTime |
Image file |
.svg |
This is the image of plot of concentration vs time data. |
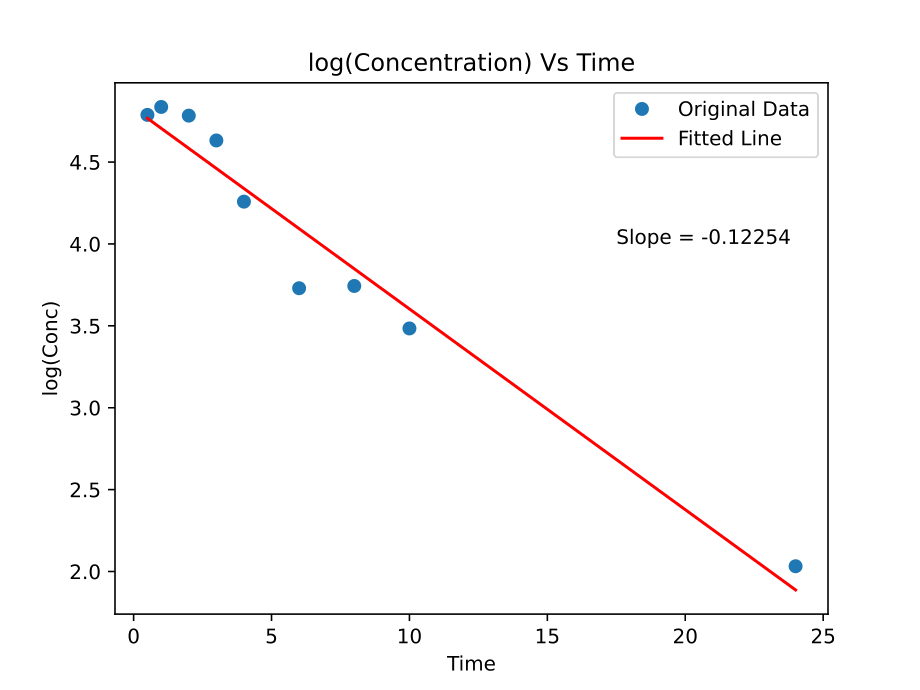
logConcVsTime |
Image file |
.svg |
This is the image of semi-log plot of concentration vs time data. |
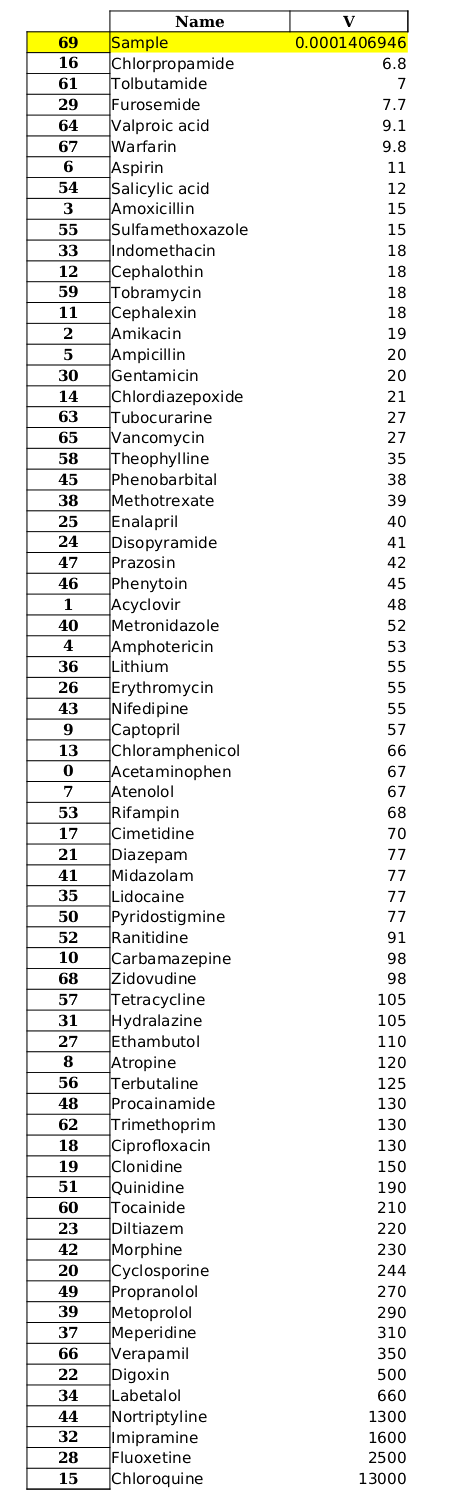
Comparison_Datasheet |
Excel file |
.xlsx |
This file holds a datasheet comprising of various known drugs name and their volume distribution value. |
Outputs
The .txt file looks like
Computation Result Log:
----------------------

Elimination Constant for provided drug: 0.12254209281701582
Half life for elimination for provided drug: 5.656400707918194
Areal Volume Distribution (V_area) for provided drug: 0.00017461881862055508
Steady State Volume Distribution (V_ss) for provided drug: 0.00014069457215783743
The plot of concentration vs time for my dataset is
The semi-log plot of concentration vs time for my dataset is
The .xlsx file looks like